Product Video vs Product Photos: Which Converts Better?
Updated 2026-10-07

Product Video vs Product Photos: Which Converts Better?
Is there a clear winner for product video vs product photos conversion rate? No universal purchase-conversion winner has been demonstrated by the commonly cited comparisons. For an e-commerce team, the useful question is whether adding video to an existing photo-led product page increases completed purchases enough to cover its cost.
For the production workflow, How to Make Product Videos Without Filming explains the broader process without requiring a filming session.
What product video vs product photos conversion rate claims actually measure
Many comparisons measure something other than purchases caused by video.
Engagement measures interaction. Purchase intent measures stated interest. Neither establishes that more visitors completed checkout. Similarly, comparisons between high-quality and low-quality photography assess photo quality, while user-generated-content comparisons may combine photos, text, and video. These findings aren't interchangeable with a controlled comparison of product-page formats.
A reported association between video-equipped pages and stronger sales also leaves important questions unanswered. Those pages might feature more popular products, better offers, or stronger traffic sources. Without comparable groups, the format's contribution remains uncertain.
Photos communicate appearance, texture, dimensions, and package contents. Product video can demonstrate movement and use in context. Those are different jobs, and production quality matters: a confusing or inaccurate video can undermine an otherwise convincing page.
The working hypothesis should therefore identify the uncertainty that motion could resolve, rather than assume that adding a player automatically improves sales.
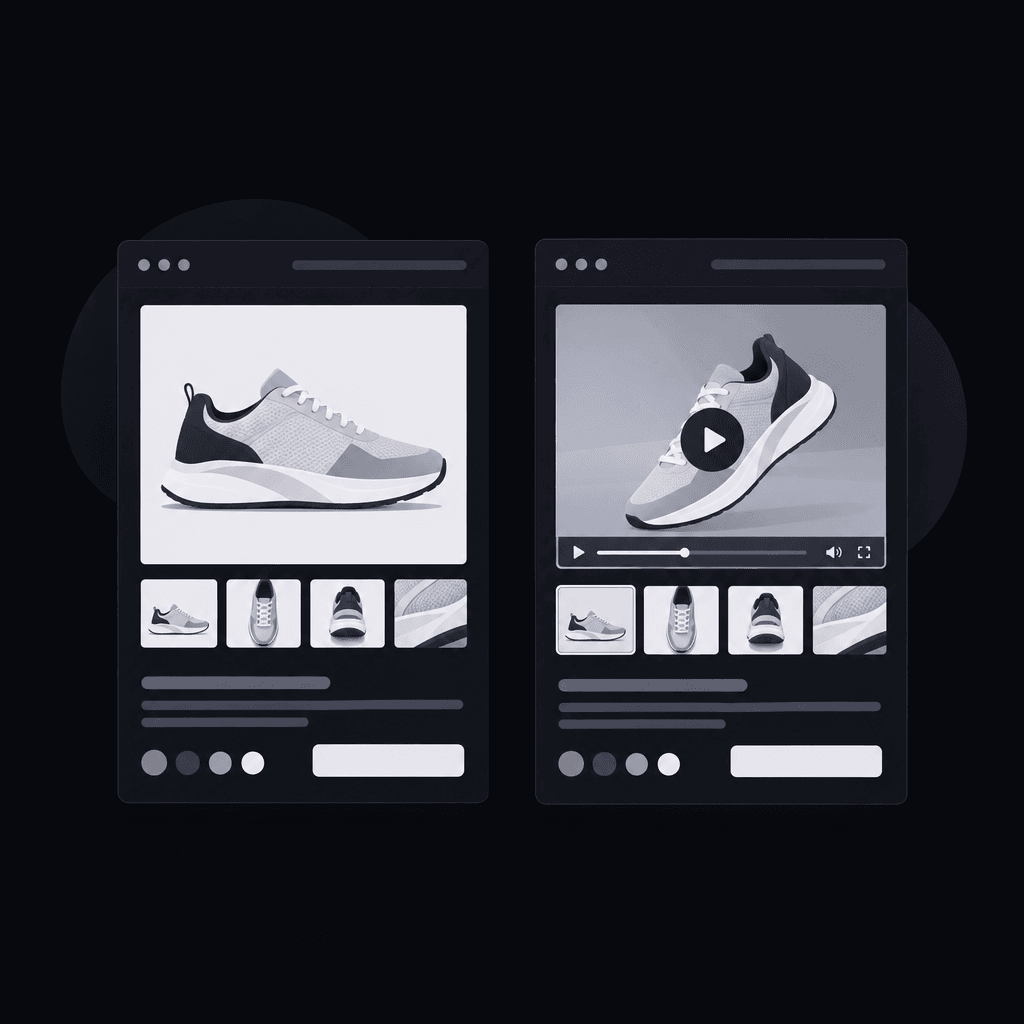
Supplement photos before testing their replacement
Adding video and replacing photos are separate experiments with different risks.
For a focused product video vs product photos conversion rate test, the first comparison should usually preserve the existing gallery. Removing photos while adding video changes both the available information and its presentation, making the result harder to interpret.
Consider a storage organizer. Photos can show its dimensions, compartments, finish, and included pieces. A proposed video could demonstrate how a drawer opens and whether stored items remain accessible. That is a testable information gap, not proof that video will increase purchases.
The creative brief should name that gap, specify the demonstrated action, and identify which product facts must stay visible in the gallery. Any depicted movement should accurately represent the product. A generated demonstration isn't independent verification of performance.
For teams considering Vidrava AI's video generation, its proposition is "one idea, one finished video." The online store product videos page provides context for that use case; neither statement predicts conversion lift.
Creative approval should also cover claim accuracy and content rights. Before planning likeness, voice, or testimonial content, teams should review the full relevant section of the acceptable use policy; generated first-person stories shouldn't be presented as verified customer testimony.

Design a product video vs product photos conversion rate test
A randomized test should change the video experience while keeping other purchase drivers consistent.
The control receives the existing photo-led page. The treatment receives the same page plus the proposed video. The intended placement and playback behavior belong in the test specification, because a gallery thumbnail and an intrusive autoplay player create different experiences.
- Define eligible visitors. Specify included product pages, traffic sources, locations, and exclusions before launch. Apply the same rules to both groups.
- Assign visitors randomly. Keep assignment persistent so returning visitors don't repeatedly switch experiences. Maintain the planned traffic allocation throughout the test.
- Hold the offer steady. Keep price, copy, discounts, shipping messaging, images, and checkout behavior equivalent across groups.
- Set the decision rules. Record the primary metric, purchase-attribution window, required sample size, and stopping method before results arrive.
- Validate tracking. Confirm that assignment, eligible visits, and completed purchases are recorded consistently, including on mobile devices.
Purchase conversion equals purchasing visitors divided by eligible visitors. Both groups need the same definition of a completed purchase and the same observation window. A visitor making multiple purchases still counts as a purchasing visitor for this metric.
Sample-size planning should use the store's baseline conversion rate and the smallest improvement worth funding. The test should span normal trading variation rather than end when an early result looks favorable.
Read purchase results without mistaking interest for impact
The main comparison belongs between assigned groups, not between video viewers and nonviewers.
Visitors who choose to watch may already be more interested in buying. Comparing them with visitors who don't watch introduces self-selection. For product video vs product photos conversion rate analysis, all eligible visitors assigned to each experience should remain in that group's primary result, whether or not they press play.
Watch rate and completion rate can help explain behavior, but they can't replace purchase conversion. An engaging demonstration that adds no profitable purchases hasn't met a sales-focused objective.
Check device behavior and page performance
Page speed, layout stability, playback errors, and mobile usability are important diagnostic measures. A video might clarify the product while its implementation slows the page or obstructs gallery navigation. Both effects belong to the tested experience.
Device-level results can reveal problems worth investigating. However, a small mobile or desktop subgroup shouldn't become a declared winner simply because its result looks promising. Planned subgroup analysis and adequate samples matter.
Keep acquisition changes outside the experiment
A new ad campaign can change visitor intent before anyone reaches the product page. Teams developing short-form social ads should separate those creative tests from the page experiment or ensure both page variants receive comparable traffic.
And the experiment shouldn't stop at the first favorable dashboard reading. Repeated early stopping can turn random fluctuation into an apparent lift. The preselected testing method should govern when conclusions are drawn.
Calculate whether incremental purchases cover the cost
A conversion improvement is commercially useful only when its contribution exceeds the associated costs.
For measuring product video ROI, teams should translate the absolute difference between treatment and control purchase conversion into expected additional purchasing visitors. Relative lift alone doesn't reveal the financial value of that difference.
| Worksheet input | Calculation or source |
|---|---|
| Absolute conversion difference | Treatment purchase conversion minus control purchase conversion |
| Incremental purchasing visitors | Eligible rollout visitors multiplied by the absolute conversion difference |
| Contribution per purchaser | Revenue less product costs, fulfillment, payment fees, expected returns, and other variable costs |
| Incremental contribution profit | Incremental purchasing visitors multiplied by contribution per purchaser |
| Net value | Incremental contribution profit minus video, implementation, and ongoing delivery costs |
This simplified worksheet assumes contribution per purchaser remains comparable. If basket values, product mix, or return behavior change materially, comparing contribution per eligible visitor offers a more complete assessment.
A product video vs product photos conversion rate result should also carry its uncertainty into the business case. A projected profit based on a fragile lift shouldn't be treated as guaranteed revenue. Where the estimated range includes a meaningful loss, additional testing or a cheaper implementation may be preferable.
Video production break-even analysis uses the same logic: total incremental costs divided by contribution per additional purchaser gives the additional purchasers needed to recover those costs. Vidrava AI uses prepaid credit packs, but the budget should also include internal review, implementation, maintenance, and delivery expenses.
FAQ
Should video replace the product photo gallery?
Usually, supplementation is the clearer first experiment. Photos provide scannable details and reference views. Replacement deserves a separate test because it removes information as well as changing format.
What is a good product video vs product photos conversion rate result?
A useful result is a sufficiently reliable purchase improvement that exceeds the team's break-even threshold without unacceptable performance or customer-experience costs. There isn't a universal lift target.
What should happen when the test is inconclusive?
The team should distinguish insufficient precision from evidence of little practical benefit. Depending on the preplanned rules, it may need more eligible traffic, a stronger hypothesis, or a decision to retain the existing page.
Does a high video completion rate justify keeping the video?
It can indicate interest, but it doesn't establish incremental purchases. A sales-focused decision still needs purchase and contribution results from the assigned groups.
For the next product video vs product photos conversion rate test, the team should check whether the asset resolves a specific buying uncertainty, preserves page performance, and generates enough incremental contribution to repay its full cost.